

asdf8
-
Posts
102 -
Joined
-
Last visited
1 Follower
asdf8's Achievements
Adventurer (3/7)
10
Reputation
-
gcriaco, You use AutoIt 3.3.13.20, try the latest version 3.3.15
-
 mLipok reacted to a post in a topic:
Another debugger for AutoIt
mLipok reacted to a post in a topic:
Another debugger for AutoIt
-
The new version in collaboration with valdemar1977: Changed interface. Fixed detected the errors. Others improvements and additions. Dbug_2016.03.25.zip
-
valdemar1977, a good idea, as well as, at the time, the idea to use checkboxes instead of buttons.
-
New version: Fixed detected the errors. Dbug_2016.03.09.zip
-
Ok.
-
valdemar1977, thanks for the report. I myself use an experimental IDE.
-
Sorry, I do not understand what is meant: that the default "Jump to Line with Breakpoint" button is not pressed, or that when pressed, there is no auto-scroll text in SciTe, or is it something else? The debugger provides such an opportunity.
-
There is a error. I thought it was because I use heavily modified editor. It will be necessary to make a debugger initialization audit. By the way, can somebody confirm or deny my assumption - TAB-control in the AutoIt, can often lead to the freezing of the application window?
-
valdemar1977 reacted to a post in a topic:
Another debugger for AutoIt
-
New version: Added the ability to create scripts with a debugger to compile. Returned to debug with OEM-console. Changed interface. Fixed detected the errors. Others improvements and additions. Dbug_2016.03.05.zip
-
This possibility implies a new version. Let me, in the near future, I will lay out a new version. Then, all together, we will find new bugs and verify old.
-
This is a serious bug in the new version it will be fixed. Well, if the array has more than 20 columns or more than 100 rows it will request to limit the output. Ok Ok I can return to the console, but do not see how it can help in other cases (except for the debug console applications)
-
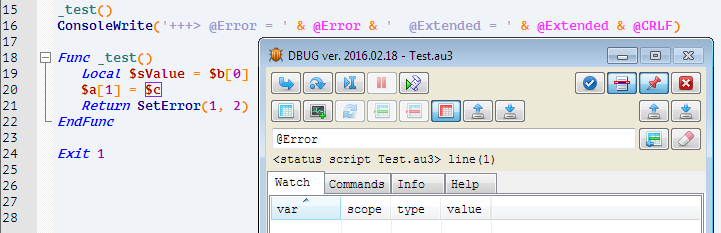
How can I reproduce this error? This is a special case of another problem. There also includes debugging scripts using PE-resources from the compiled applications, debugging script running as a service, debug interprocess communication scripts, etc. All this can be solved by debugging compiled script. The next version will have the opportunity to add to the source code debugger, which can then compile and debug in real conditions of use. Browse the list is disabled by default, this speeds up the work of the debugger, if the script is paused variables can be viewed directly in the editor by placing the mouse over them, if you move the cursor to an empty list of variables appears tooltip - To automatically update expressions list, toggle button "Clear expressions list". F8 - "Step Over Scope", first scope was a "Global", reaching 19 line steel in scope function "_test", the scope has changed - debugger stood pause. Edit commands and expressions in the same place where they are displayed, saved in the ini-file, next to the script being debugged. It concerned the debugger debugging and should not have any value to users. This multi-line construction, during the execution of AutoIt transforms it into a single line, so the breakpoint is only possible on the first line of this design.
-
valdemar1977 reacted to a post in a topic:
Another debugger for AutoIt
-
gcriaco, thank you for your bug report. Try to reload the archive from the previous post.
-
Update debugger: Changed interface. Fixed detected the errors. Others improvements and additions. Dbug_2016.02.18.zip
-
Ok, icl-file with named icons can be displayed on a single computer and are not displayed on the other. This is strange.