Search the Community
Showing results for tags 'chart'.
Found 7 results
-
This is the "General Help and Support" thread for the ExcelChart UDF. The UDF itself can be downloaded So if you have any questions, suggestions or errors please post here.
-
Hi all, For my work, i need to produce automatically chart that i will include in my morning email. First I tried the graph function of powershell with Microsoft Chart Controls , very nice looking, with help of this script : https://gallery.technet.microsoft.com/Drawing-charts-with-6ab5de4e#content BUT is useless as i can't sort data in graph ( object array is ***** in powershell, order is random ) So trying back with autoit. After lot of forum research : RMChart : not working Another script not working, or working but only in autoit GUI ( or can't find the good topic ) Chart.udf : nice but not in GDI so can't produce image ImageMagick : possible but very hard to code the entire line can't use excel, because can't install it on the production server. In a perfect world i would produce this : But simplest will be fine too : Do you know an another solution, any help would be greatly appreciated.
-
Hello everyone, For a measurement application, I need to put a 2D graphic inside a tab control (inside the second tab). But I can’t get the graph to appear only in the second tab. Please, what am I doing wrong? #include <GraphGDIPlus_UDF.au3> $ID0 = GUICreate("TEST 2D Graphic",1000,600) $idTabCAB = GUICtrlCreateTab(10,10,980,500) ; TabItem definition ************************ $TAB1 = GUICtrlCreateTabItem(" TAB 1 ") GUICtrlCreateLabel("First Tab.",50,70,400,25) ;--------------------------------------- $TAB2 = GUICtrlCreateTabItem(" TAB 2 ") GUICtrlCreateLabel("Second Tab.",50,70,400,25) GUICtrlCreateLabel("Title of the graphic",520,70,400,25) GUICtrlSetFont(-1,10,800,0,"Arial Narrow") $Graph = _GraphGDIPlus_Create($ID0,520,100,400,200,0xFF000000,0xFFE0F0FF) _GraphGDIPlus_Set_RangeX($Graph,1,52,25,1,0) _GraphGDIPlus_Set_RangeY($Graph,0,100,10,1,0) ;----- Trace the curve ----------------- TraceCurve() ;--------------------------------------- $TAB3 = GUICtrlCreateTabItem(" TAB 3 ") GUICtrlCreateLabel("Third Tab.",50,70,400,25) ;*********************************************** GUICtrlCreateTabItem(""); end tabitem definition GUISetState() While 1 Local $msg = GUIGetMsg() Select Case $msg = -3 ;[Exit] ExitLoop EndSelect WEnd ;----- close down GDI+ and clear graphic ----- _GraphGDIPlus_Delete($ID0,$Graph) GUISetState(@SW_HIDE) Exit Func TraceCurve() _GraphGDIPlus_Set_PenColor($Graph,0xFF0084FF) _GraphGDIPlus_Set_PenSize($Graph,2) _GraphGDIPlus_Plot_Start($Graph,0,0) For $X=1 to 52 Step 1 $Y = Random(1,100,1) ; Random values for example. _GraphGDIPlus_Plot_Line($Graph,$X,$Y) _GraphGDIPlus_Refresh($Graph) Next EndFunc Someone is so kind to help me. This is my script. thank you very much in advance.
-
Version 0.4.0.1
1,158 downloads
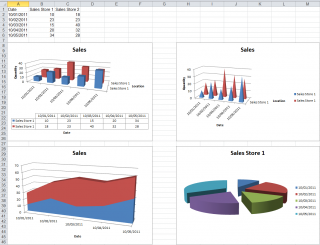
Extensive library to control and manipulate Microsoft Excel charts. Written by GreenCan and water. Theads: General Help & Support - Example Scripts BTW: If you like this UDF please click the "I like this" button. This tells me where to next put my development effort KNOWN BUGS (last changed: 2017-07-21) None. The COM error handling related bugs have been fixed. -
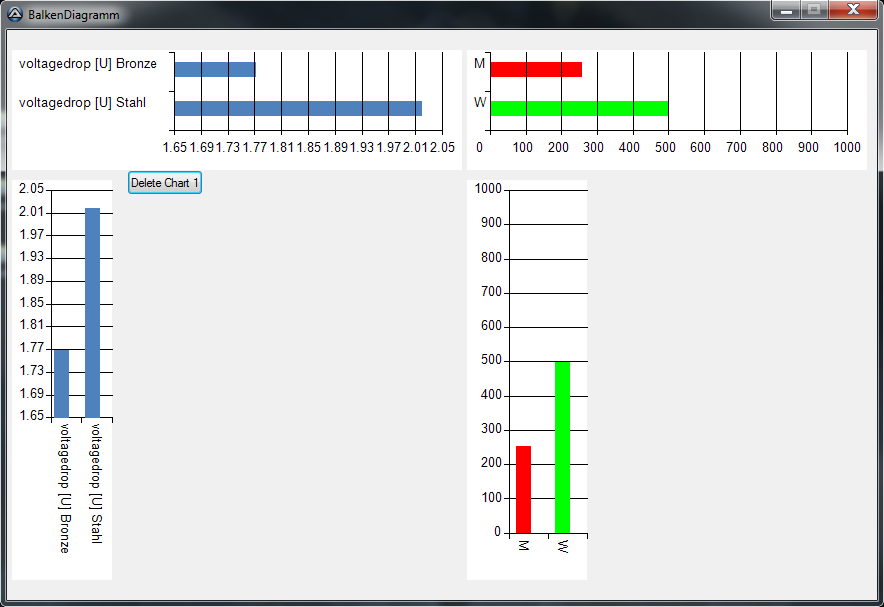
This UDF can be used to Display bar charts in a window. I hope you can need it. Exampleimage: If you like it, please leave me a comment, also if you have any suggestions to make it better or if you found bugs. Chart_UDF_source.zip

-
In this thread you will find some useful scripts based on the ExcelChart UDF (for download please see my signature).
-
Is anyone familiar with the color management of Excel with charts? Is there any good reading you can recommend? MSDN just gives a listing of all objects, methods and properties but no explanation how they are related and how to use them? Properties like Color, ColorIndex, SchemeColor, ObjectThemeColor, ThemeColor confuse me a bit. Any hint is greatly appreciated.