Search the Community
Showing results for tags 'statistics'.
Found 4 results
-
 PDH Performance Counters Measure Process, CPU, Network, Process, Disk (etc) Usage (note that the above dialog appears differently on Vista+) New ObjectBase interface!! *x64 and Localization Issues have been resolved!* *Download and License agreement are at the bottom of this post! About The Project: Performance Counters gather all kind of performance data about the PC and the Network using the standard PDH.DLL module (standard since Windows 2000). Among the performance data you can collect and monitor are: Processor Stats (including total usage)Process (programs) Stats (including CPU usage)Disk Stats (speed/access)TCP, UDP, IP Connection Counts, Speed/Error StatsNetwork Stats..and so onNote that one example is a WIP. 'TaskManager' mockup UDF, I'm looking at you. You can jump right in, download the two AutoIT files (below) and run one of the following to see what the PDH Performance Counters project can get you: TestPDH_PerformanceCounters - this is where you should start! It allows you to visually experiment with most all of the Counters available on your PC and Network. NOTES: - Currently the 'Refresh' rate is set to 1/2 second - this can be changed by altering the Adlib() function frequency - New Counters that come into existence during monitoring will *not* be added to the list (this would be a function I've yet to add) - Counters that become invalid are simply given a prefix of '[Dead Counter Handle]:' TestPDH_ProcessLoop - this basically repeatedly shows an extended Process-information list for all processes. NOTE: You must hit 'ESC' to exit the loop TestPDH_TaskManager - this gathers and displays most everything you'd see in the Process and Performance sections of Task Manager. NOTES: - The screen does NOT update, and the UDF is a MESS. This is due to a number of reasons - the biggest one being laziness on my behalf. Plus I need to figure out how best to manage ListView changes. - TWO fields need Windows XP+ to display correctly (or a version of psapi.dll that supports 'GetPerformanceInfo'): Commit Charge (Peak) and System Cache TestPDH_ProcessGetRelatives - this shows how the PDH Performance Counters can be used to get 'parent' and 'children' process information. There are more practical means of getting this info of course (a few you'll see in my 'Process Functions' module, but hey - its just yet another example of what can be done.TestPDH_ObjectTests - this is more for reading/understanding the code than anything. It is there to show how the new 'ObjectBase' Interface works to make coding Performance Counters *much* easier.Multipile extra 'TestPDH*' examplesAt its most basic, interacting with Performance Counters is as such: The brand new ObjectBase Interface removes some of the difficulty in interacting with Performance Counters, and works like this: Examples of the new ObjectBase interface: % CPU Usage of a Process % CPU Usage of Multiple Instances of a Process (+monitoring and adjustment based on new/dead Instances) Other Examples: Waiting for Hard Disk activity to Idle for 'x' ms % System CPU Usage (by Processor) Network Usage (bytes sent/received) I've put a LOT of work into this project, and all I ask is that you follow my License Agreement when using the code (very easy, see below). Any feedback is welcome. I apologize for the unpolished GUI interfaces (especially the unfinished one), but I will get to that TaskManager GUI one day, hah. Enough chatter -now go on and experience the awesome power of Performance Counters Download the ZIP Here NOTE: Bundled in the ZIP (and included in the License agreement) are other UDF's I wrote that are necessary to run some of the 'Test' programs:_WinAPI_GetSystemInfo.au3, _WinAPI_GetPerformanceInfo.au3, _WinTimeFunctions.au3, and the unnecessary, but provided for those who are interested in the _WinTimeFunctions 'filetime' usage, program: TestWinTimeFunctions.au3. Ascend4nt's AutoIT Code License agreement: While I provide this source code freely, if you do use the code in your projects, all I ask is that: If you provide source, keep the header as I have put it, OR, if you expand it, then at least acknowledge me as the original author, and any other authors I creditIf the program is released, acknowledge me in your credits (it doesn't have to state which functions came from me, though again if the source is provided - see #1)The source on it's own (as opposed to part of a project) can not be posted unless a link to the page(s) where the code were retrieved from is provided and a message stating that the latest updates will be available on the page(s) linked to.Pieces of the code can however be discussed on the threads where Ascend4nt has posted the code without worrying about further linking.Enjoy!Ascend4nt UPDATES:
- 135 replies
-
- 3
-

-

-
- performance counters
- monitor
- (and 8 more)
-
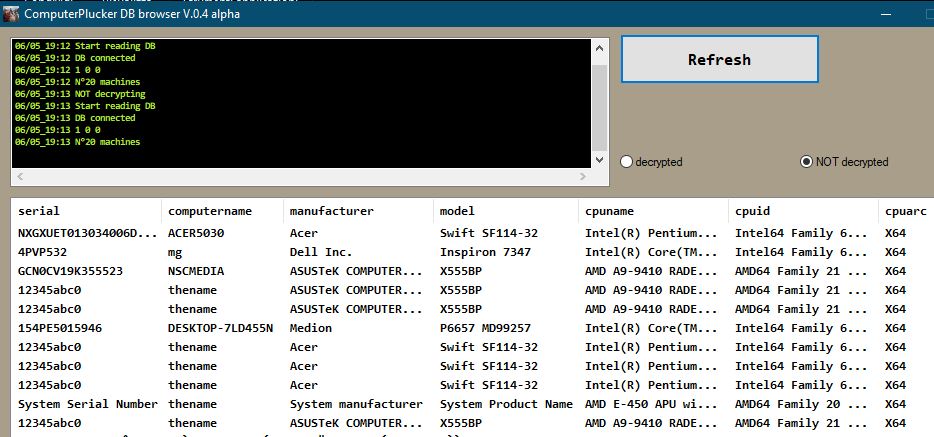
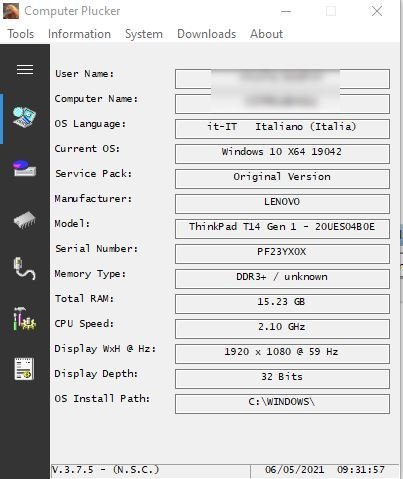
Computer Plucker is a fork and a "restoration" of Computer stats utility by @Rogue5099 (link) You can obtain various data about local machine, as from the screenshot. But my goal is not (only) to provide another PC stats tool, but to develop a very basic remote inventory tool, like (a small subset of) the abandoned Spiceworks or the Microsoft SCCM. So this script can be deployed on a machine as a standalone executable (yes you need only ONE file to distribute) , and launching the .EXE it installs itself to a folder (es. c:\autoit\computerplucker) In tools menù you can set two tasks and not only one for creating every week a file.ini with all the data of the machine. another one for creating every week a file.ini with all the data of the machine PLUS uploading a CRYPTED record of the machine in a free mysql DB online For my needs, I am deploying the .exe and schedule the second task, uploading data one time a week. In tools menù you will find also commands for: manual creating the .ini data file to upload the data in crypted records to upload the data in clear text records (for testing..) total uninstall of ComputerPlucker, with a simple security code. many other tasks in not so logical order.. next version I have to tidy the menù... So my plan is to deploy this on my machines, and have the data in a online DB, this DB will be for me only a "cache" for data records to be downloaded (and deleted) by another script. As today the account of this TEST DB is embedded in code, using the "File to Base64 String' Code Generator" by @UEZ (used also for embedding icons and XML task definitions) Local $mysqlhost = "sql11.freemysqlhosting.net" Local $mysqlport = "3306" Local $mysqldb = "sql11403701" Local $mysqluser = "sql11403701" Local $mysqlpsw = "QtL7T9U5GV" The DB is one table of 30 mysql tinytext fields... very simple indeed... You can try to upload data to this DB and access (phpmyadmin or a random mysql browser app) to see the results. Or you can use my ComputerPluckerDBbrowser (see at the end of this post) a script to collect and manage the data. PRIVACY warning: you are uploading data of your PC account and PC data, test as your risk (or test in another account...) I also created a small post in a blog for not so geek friends, and I have a more advanced version of the data browser, you can have more info lookin' here. 😀 Attached you will find the code, and all the necessary includes are at this >link<. ComputerPlucker.EXE is downloadable >HERE< ComputerPluckerDBbrowser.EXE is downloadable >HERE< ComputerPluckerDBbrowser_LITE.au3 ComputerPlucker.au3

- 18 replies
-
- 2
-
-
- pc
- statistics
- (and 3 more)
-
Process CPU Usage Trackers As yet another alternative to the Performance Counters UDF, I've created this UDF to allow easy tracking of one or more processes's CPU usage. While this has obviously been done before, I haven't seen it done the way I've created it. Basically, just as the Performance Counters had Process Counter objects, so this too has Process Usage trackers. They are relatively simple to use, and require very little interaction other than invoking the functions. To create a new tracker object, call one of these: _ProcessUsageTracker_Create() ; Single process tracker _ProcessesUsageTracker_Create() ; Multiple processes tracker The multiple-process tracker requires addition of processes, which can be done one of 2 ways: _ProcessesUsageTracker_Add() ; add a single process _ProcessesUsageTracker_AddMultiple() ; multiple processes in a ProcessList-style array After the usage tracker object has been created, stats can be collected via one of two calls: _ProcessUsageTracker_GetUsage() ; single process - returns a percentage _ProcessesUsageTracker_GetUsage() ; multiple Processes - returns an array of %'s Basically the main loop of the program can be filled with 'GetUsage' calls without juggling anything around. If a process dies out, an @error code will be returned in the single-process version. The multiple-process tracker version however lets you retain dead processes in the list although their process handles will be closed. These can be alternatively cleared up on each call to 'GetUsage' (setting $bRemoveDead to True), or you can opt to clean them up with the following call: _ProcessesUsageTracker_RemoveDead() ; Removes any dead processes from the tracker object Finally, to destroy the trackers and close handles, just call the appropriate function: _ProcessUsageTracker_Destroy() _ProcessesUsageTracker_Destroy() That's about it. More info is in the headers. Here's an example of a single process cpu usage tracker: ; ======================================================================================================== ; <Process_CPUUsageExample.au3> ; ; Example usage of <Process_CPUUsage.au3> ; ; Author: Ascend4nt ; ======================================================================================================== #include "Process_CPUUsage.au3" ; -------------------- HOTKEY FUNCTION & VARIABLE -------------------- Global $bHotKeyPressed=False Func _EscPressed() $bHotKeyPressed=True EndFunc ; -------------------- MAIN PROGRAM CODE -------------------- HotKeySet("{Esc}", "_EscPressed") Local $hSplash, $sSplashText Local $sProcess, $aProcUsage, $fUsage ; Regular Process: ;~ $sProcess = "firefox.exe" ;~ $sProcess = "sp2004.exe" ; Stress Prime 2004 ; Protected Process (opens a different way): ;~ $sProcess = "audiodg.exe" ; Processes Requiring elevated privilege (will fail even with limited access rights): ;~ $sProcess = "CTAudSvc.exe" $sProcess = InputBox("Enter Process Name", "Process Name:", "", "", 320, 140) If @error Or $sProcess = "" Then Exit $aProcUsage = _ProcessUsageTracker_Create($sProcess) If @error Then Exit ConsoleWrite("Error calling _ProcessUsageTracker_Create(): " & @error & ", @extended = " & @extended & @CRLF) Sleep(250) $hSplash=SplashTextOn("Process CPU Usage Information", "", 360, 20 + 60, Default, Default, 16, Default, 12) ; Start loop Do $sSplashText="" $fUsage = _ProcessUsageTracker_GetUsage($aProcUsage) If @error Then ConsoleWrite("Error from _ProcessUsageTracker_GetUsage(): " & @error & ", @extended = " &@extended & @CRLF) ExitLoop EndIf $sSplashText &= "'"&$sProcess&"' CPU usage: " & $fUsage & " %" & @CRLF $sSplashText &= @CRLF & "[Esc] exits" ControlSetText($hSplash, "", "[CLASS:Static; INSTANCE:1]", $sSplashText) Sleep(500) Until $bHotKeyPressed _ProcessUsageTracker_Destroy($aProcUsage) _ Multiple processes example, which is best used with something like 'chrome' which spawns a number of processes with the same name: ; ======================================================================================================== ; <Processes_CPUUsageExample.au3> ; ; Example usage of <Processes_CPUUsage.au3> ; ; Author: Ascend4nt ; ======================================================================================================== #include "Processes_CPUUsage.au3" ; -------------------- HOTKEY FUNCTION & VARIABLE -------------------- Global $bHotKeyPressed=False Func _EscPressed() $bHotKeyPressed=True EndFunc ; -------------------- MAIN PROGRAM CODE -------------------- HotKeySet("{Esc}", "_EscPressed") Local $hSplash, $sSplashText Local $sProcess, $aProcList, $aProcUsage, $aPercents, $nPercents ; Regular Process: ;~ $sProcess = "firefox.exe" ;~ $sProcess = "sp2004.exe" ; Stress Prime 2004 ; Protected Process (opens a different way): ;~ $sProcess = "audiodg.exe" ; Processes Requiring elevated privilege (will fail even with limited access rights): ;~ $sProcess = "CTAudSvc.exe" $sProcess = InputBox("Enter Process Name", "Process Name:", "", "", 320, 140) If @error Or $sProcess = "" Then Exit $aProcUsage = _ProcessesUsageTracker_Create() _ProcessesUsageTracker_Add($aProcUsage, "sp2004.exe") _ProcessesUsageTracker_Add($aProcUsage, "CPUStabTest.exe") $aProcList = ProcessList("chrome.exe") _ProcessesUsageTracker_AddMultiple($aProcUsage, $aProcList) _ProcessesUsageTracker_Add($aProcUsage, $sProcess) _ProcessesUsageTracker_Add($aProcUsage, "audiodg.exe") Sleep(250) $hSplash=SplashTextOn("Process CPU Usage Information", "", 380, 24 + 15*2 + $aProcUsage[0][0]*15, Default, Default, 16+4, "Lucida Console", 11) ; Start loop Do ; DEBUG: Interrupt to allow multiple process termination ;MsgBox(0, "Next usage", "Next usage time..") $sSplashText="" $aPercents = _ProcessesUsageTracker_GetUsage($aProcUsage, True) ; True = Remove dead $nPercents = @extended If @error Then ConsoleWrite("Error from _ProcessesUsageTracker_GetUsage(): " & @error & ", @extended = " &@extended & @CRLF) ExitLoop EndIf For $i = 0 To $nPercents - 1 $sSplashText &= "'"&$aProcUsage[$i+1][0]&"' [PID #"&$aProcUsage[$i+1][1]&"] CPU usage: " & $aPercents[$i] & " %" & @CRLF Next $sSplashText &= @CRLF & "[Esc] exits" ControlSetText($hSplash, "", "[CLASS:Static; INSTANCE:1]", $sSplashText) Sleep(500) Until $bHotKeyPressed _ProcessesUsageTracker_Destroy($aProcUsage) ProcessCPUUsage.zip
-
Disk and Device Read/Write (I/O) Statistics This is an example of getting and displaying Read/Write Activity for all Disks and Device I/O. The actual UDF function _NTQuerySysPerfInfo() returns a whole lot more Performance Information for the computer; however, we are focused on I/O activitiy here. This was written as a faster alternative to WMI, as well as an alternative to >Performance Counters (see my >Physical Disk Read/Write activity example). Update 2013-07-06: Changed: Renamed module Changed: _AddCommas now uses a nicer PCRE Fixed - Copy and paste errors Added - Comma separators DiskDeviceIOStatistics.au3 ; ======================================================================================================== ; <DiskDeviceIOStatistics.au3> ; ; Example of reading and displaying Disk and Device I/O Statistics, using a 'Spash' window ; NOTE There is alot more data returned from _NTSysPerformanceInfo(), but ; for our purposes, we focus only on I/O data ; ; Functions: ; _NTSysPerformanceInfo() ; Returns I/O and a whole slew of other Performance Info ; ; Author: Ascend4nt ; ======================================================================================================== ; =================================================================================================================== ; Func _NTSysPerformanceInfo() ; ; Returns Disk & Device I/O Statistics (and much more) from NtQuerySystemInformation. ; ; NOTE: ZWReadFile and ZWWriteFile are low-level File I/O that are called by higher-level File I/O ; (such as ReadFile and WriteFile) ; ; Returns: ; Success: Array of I/O and Performance Stats: ; [0] = Idle Time of all CPU's on the system (in 100-nanosecond intervals) ; [1] = # of Bytes Read through ZWReadFile calls ; [2] = # of Bytes Written through ZWWriteFile calls ; [3] = # of Bytes for all Other I/O Operations (such as Device I/O) ; [4] = # of calls made to ZWReadFile (NOT the # of bytes - see [1]) ; [5] = # of calls made to ZWWriteFile (NOT the # of bytes - see [2]) ; [6] = # of calls to other I/O Operations (such as Device I/O) - see [3] ; [7] = # of Physical Pages Available to Processes ; [8] = # of Commited Pages of Virtual Memory ; [9] = Commit Limit - # of Pages that can be committed before extending PageFile ; [10] = Peak # of Pages of Committed Virtual Memory ; [11] = # of Page Faults (soft and hard) ; [12] = # of Write Faults (attempts to write to copy-on-write pages) ; [13] = # of Soft Page Faults [TransitionFaults] ; [14] = # of Demand Zero Faults ; [15] = # of Pages Read from Disk to Resolve Page Faults ; [16] = # of Read Operations to Resolve Page Faults [not # of pages] ; [17] = # of Pages Written to System's Pagefiles ; [18] = # of Write operations performed on System's Pagefiles ; .. alot more info (see SYSTEM_PERFORMANCE_INFO structure) .. ; [73] = # of System Calls ; ; Failure: "" with @error set: ; @error = 2: DLLCall error, @extended = error returned from DLLCall ; @error = 3: NTSTATUS returned error code, @extended contains error code ; ; Author: Ascend4nt ; =================================================================================================================== Func _NTQuerySysPerfInfo() #cs ; SYSTEM_PERFORMANCE_INFORMATION Defined as size 312 in latest <winternl.h>, ; but on Win7 this is 328 (both 32-bit and 64-bit modes). ; For now I've added a buffer at the end of 16 bytes (+ 16 more for future issues). ; Hopefully eventually I'll be able to track down what the extra data is. ; Its obviously not a 32-bit vs 64-bit size difference.. #ce Local Const $tagSYSTEM_PERFORMANCE_INFORMATION = "uint64 IdleTime;uint64 ReadTransferCount;uint64 WriteTransferCount;uint64 OtherTransferCount;" & _ "ULONG ReadOperationCount;ULONG WriteOperationCount;ULONG OtherOperationCount;" & _ "ULONG AvailablePages;ULONG TotalCommittedPages;ULONG TotalCommitLimit;ULONG PeakCommitment;" & _ "ULONG PageFaults;ULONG WriteCopyFaults;ULONG TransitionFaults;ULONG Reserved1;ULONG DemandZeroFaults;ULONG PagesRead;ULONG PageReadIos;" & _ "ULONG Reserved2[2];ULONG PagefilePagesWritten;ULONG PagefilePageWriteIos;ULONG MappedFilePagesWritten;ULONG MappedFilePageWriteIos;" & _ "ULONG PagedPoolUsage;ULONG NonPagedPoolUsage;ULONG PagedPoolAllocs;ULONG PagedPoolFrees;ULONG NonPagedPoolAllocs;ULONG NonPagedPoolFrees;" & _ "ULONG TotalFreeSystemPtes;ULONG SystemCodePage;ULONG TotalSystemDriverPages;ULONG TotalSystemCodePages;" & _ "ULONG SmallNonPagedLookasideListAllocateHits;ULONG SmallPagedLookasideListAllocateHits;ULONG Reserved3;" & _ "ULONG MmSystemCachePage;ULONG PagedPoolPage;ULONG SystemDriverPage;" & _ "ULONG FastReadNoWait;ULONG FastReadWait;ULONG FastReadResourceMiss;ULONG FastReadNotPossible;ULONG FastMdlReadNoWait;" & _ "ULONG FastMdlReadWait;ULONG FastMdlReadResourceMiss;ULONG FastMdlReadNotPossible;" & _ "ULONG MapDataNoWait;ULONG MapDataWait;ULONG MapDataNoWaitMiss;ULONG MapDataWaitMiss;" & _ "ULONG PinMappedDataCount;ULONG PinReadNoWait;ULONG PinReadWait;ULONG PinReadNoWaitMiss;ULONG PinReadWaitMiss;" & _ "ULONG CopyReadNoWait;ULONG CopyReadWait;ULONG CopyReadNoWaitMiss;ULONG CopyReadWaitMiss;" & _ "ULONG MdlReadNoWait;ULONG MdlReadWait;ULONG MdlReadNoWaitMiss;ULONG MdlReadWaitMiss;" & _ "ULONG ReadAheadIos;ULONG LazyWriteIos;ULONG LazyWritePages;ULONG DataFlushes;ULONG DataPages;" & _ "ULONG ContextSwitches;ULONG FirstLevelTbFills;ULONG SecondLevelTbFills;ULONG SystemCalls;" & "ULONG Buffer[8];" Local $stSysPerfInfo,$iSysInfoLen $stSysPerfInfo = DllStructCreate($tagSYSTEM_PERFORMANCE_INFORMATION) $iSysInfoLen = DllStructGetSize($stSysPerfInfo) ;~ ConsoleWrite("SYSTEM_PERFORMANCE_INFORMATION structure size:" & $iSysInfoLen & @CRLF) ; SystemPerformanceInformation = class 2 Local $aRet=DllCall("ntdll.dll","long","NtQuerySystemInformation","int",2,"ptr",DllStructGetPtr($stSysPerfInfo),"ulong",$iSysInfoLen,"ulong*",0) If @error Then Return SetError(2, @error, "") ; NTSTATUS of something OTHER than success? If $aRet[0] Then ;~ If $aRet[0] = 0xC0000004 Then ConsoleWrite("STATUS_INFO_LENGTH_MISMATCH, size required: " &$aRet[4] & @CRLF) Return SetError(3, $aRet[0], "") EndIf ;~ If $aRet[4]<>$iSysInfoLen Then ConsoleWriteError("Size mismatch: $stInfo struct length="&$iSysInfoLen&", ReturnLength="&$aRet[4]&@LF) ;~ _DLLStructDisplay($stSysPerfInfo, $tagSYSTEM_PERFORMANCE_INFORMATION) Dim $aRet[74] For $i = 1 To 74 $aRet[$i - 1] = DllStructGetData($stSysPerfInfo, $i) Next Return $aRet EndFunc ; ==================================================================================================== ; Func _AddCommas($sString) ; ; Simple PCRE to add commas - borrowed from StackOverflow ; "regex - Insert commas into number string" - answer by toolkit: ; @ http://stackoverflow.com/a/721415 ; ; Author: Ascend4nt ; ==================================================================================================== Func _AddCommas($sString) Return StringRegExpReplace($sString, "(\d)(?=(\d{3})+$)", "$1,") EndFunc ; -------------------- HOTKEY FUNCTION & VARIABLE -------------------- Global $bHotKeyPressed = False Func _EscPressed() $bHotKeyPressed=True EndFunc ; -------------------- MAIN PROGRAM CODE -------------------- HotKeySet("{Esc}", "_EscPressed") Local $hSplash, $sSplashText Local $aIOStats $aIOStats = _NTQuerySysPerfInfo() If @error Then Exit ConsoleWrite("@error = " &@error & ", @extended = " &Hex(@extended) & @CRLF) EndIf ConsoleWrite(" I/O Stats: Read = " & _AddCommas($aIOStats[1]) & "; Write = " & _AddCommas($aIOStats[2]) & "; Other = " & _AddCommas($aIOStats[3]) & @CRLF) $hSplash=SplashTextOn("Hard Drive Usage Information", "", 740, 24 + (4 * 15), Default, Default, 16+4, "Lucida Console", 11) ; Start loop Do $aIOStats = _NTQuerySysPerfInfo() $sSplashText = StringFormat("%50s", "== I/O Stats ==") & @CRLF $sSplashText &= StringFormat("Read = %20s | Write = %20s | Other = %20s", _AddCommas($aIOStats[1]), _AddCommas($aIOStats[2]), _AddCommas($aIOStats[3])) & @CRLF $sSplashText &= @CRLF & StringFormat("%48s", "[ESC] Exits") & @CRLF ControlSetText($hSplash, "", "[CLASS:Static; INSTANCE:1]", $sSplashText) Sleep(500) Until $bHotKeyPressed
- 4 replies
-
- 3
-
-
- IO Activitiy
- Hard Drive
- (and 4 more)