
Saxo
-
Posts
11 -
Joined
-
Last visited
Recent Profile Visitors
139 profile views

Saxo's Achievements
Seeker (1/7)
0
Reputation
-
Yes, a chart says more than a thousand words

-
Hi water Ok - no problem. Thx for the explanation.Yes. The answer was already in the code - sorry for failing to see that.For anybody interested I have pasted an updated version of the initial example. Note that D1 does not have any S2, S1, P, R1 & R2 calculated, because the values are based on the previous day's OHLC. Once again water, thank you for your tremendous help in getting the example working just the way I wanted. Best Regards, Saxo #region ;**** Directives created by AutoIt3Wrapper_GUI **** #AutoIt3Wrapper_Res_requestedExecutionLevel=asInvoker #endregion ;**** Directives created by AutoIt3Wrapper_GUI **** #include <ExcelChart.au3> #include <Array.au3> #include <Excel.au3> Example() Exit Func Example() Global $iXLC_Debug = 2 ;(or = 1) Local $oExcel = _ExcelBookNew() ; Disable Screen updating (forced even when debugging is activated) _XLChart_ScreenUpdateSet($oExcel, 2) _ExcelWriteCell($oExcel, "Date", 1, 1) _ExcelWriteCell($oExcel, "D1", 2, 1) _ExcelWriteCell($oExcel, "D2", 3, 1) _ExcelWriteCell($oExcel, "D3", 4, 1) _ExcelWriteCell($oExcel, "D4", 5, 1) _ExcelWriteCell($oExcel, "D5", 6, 1) $oExcel.ActiveSheet.Columns(1).AutoFit _ExcelWriteCell($oExcel, "O", 1, 2) _ExcelWriteCell($oExcel, "69,342", 2, 2) _ExcelWriteCell($oExcel, "69,342", 3, 2) _ExcelWriteCell($oExcel, "69,203", 4, 2) _ExcelWriteCell($oExcel, "69,204", 5, 2) _ExcelWriteCell($oExcel, "69,485", 6, 2) $oExcel.ActiveSheet.Columns(2).AutoFit _ExcelWriteCell($oExcel, "H", 1, 3) _ExcelWriteCell($oExcel, "68,826", 2, 3) _ExcelWriteCell($oExcel, "69,375", 3, 3) _ExcelWriteCell($oExcel, "69,463", 4, 3) _ExcelWriteCell($oExcel, "69,364", 5, 3) _ExcelWriteCell($oExcel, "69,598", 6, 3) $oExcel.ActiveSheet.Columns(3).AutoFit _ExcelWriteCell($oExcel, "L", 1, 4) _ExcelWriteCell($oExcel, "68,263", 2, 4) _ExcelWriteCell($oExcel, "68,654", 3, 4) _ExcelWriteCell($oExcel, "69,085", 4, 4) _ExcelWriteCell($oExcel, "68,891", 5, 4) _ExcelWriteCell($oExcel, "69,251", 6, 4) $oExcel.ActiveSheet.Columns(4).AutoFit _ExcelWriteCell($oExcel, "C", 1, 5) _ExcelWriteCell($oExcel, "68,403", 2, 5) _ExcelWriteCell($oExcel, "68,882", 3, 5) _ExcelWriteCell($oExcel, "69,307", 4, 5) _ExcelWriteCell($oExcel, "68,135", 5, 5) _ExcelWriteCell($oExcel, "69,450", 6, 5) $oExcel.ActiveSheet.Columns(5).AutoFit _ExcelWriteCell($oExcel, "P=(O+H+L+C)/4", 1, 6) _ExcelWriteFormula($oExcel, "", 2, 6) _ExcelWriteFormula($oExcel, "=SUM(R2C2:R2C5)/4", 3, 6) _ExcelWriteFormula($oExcel, "=SUM(R3C2:R3C5)/4", 4, 6) _ExcelWriteFormula($oExcel, "=SUM(R4C2:R4C5)/4", 5, 6) _ExcelWriteFormula($oExcel, "=SUM(R5C2:R5C5)/4", 6, 6) $oExcel.ActiveSheet.Columns(6).AutoFit _ExcelWriteCell($oExcel, "S2=P-(H-L) ", 1, 7) _ExcelWriteFormula($oExcel, "", 2, 7) _ExcelWriteFormula($oExcel, "=R3C6-(R2C3-R2C4)", 3, 7) _ExcelWriteFormula($oExcel, "=R4C6-(R3C3-R3C4)", 4, 7) _ExcelWriteFormula($oExcel, "=R5C6-(R4C3-R4C4)", 5, 7) _ExcelWriteFormula($oExcel, "=R6C6-(R5C3-R5C4)", 6, 7) $oExcel.ActiveSheet.Columns(7).AutoFit _ExcelWriteCell($oExcel, "S1=2×P-H", 1, 8) _ExcelWriteFormula($oExcel, "", 2, 8) _ExcelWriteFormula($oExcel, "=2*R3C6-R2C3", 3, 8) _ExcelWriteFormula($oExcel, "=2*R4C6-R3C3", 4, 8) _ExcelWriteFormula($oExcel, "=2*R5C6-R4C3", 5, 8) _ExcelWriteFormula($oExcel, "=2*R6C6-R5C3", 6, 8) $oExcel.ActiveSheet.Columns(8).AutoFit _ExcelWriteCell($oExcel, "R1=2×P-L", 1, 9) _ExcelWriteFormula($oExcel, "", 2, 9) _ExcelWriteFormula($oExcel, "=2*R3C6-R2C4", 3, 9) _ExcelWriteFormula($oExcel, "=2*R4C6-R3C4", 4, 9) _ExcelWriteFormula($oExcel, "=2*R5C6-R4C4", 5, 9) _ExcelWriteFormula($oExcel, "=2*R6C6-R5C4", 6, 9) $oExcel.ActiveSheet.Columns(9).AutoFit _ExcelWriteCell($oExcel, "R2=P+(H-L)", 1, 10) _ExcelWriteFormula($oExcel, "", 2, 10) _ExcelWriteFormula($oExcel, "=R3C6+(R2C3-R2C4)", 3, 10) _ExcelWriteFormula($oExcel, "=R4C6+(R3C3-R3C4)", 4, 10) _ExcelWriteFormula($oExcel, "=R5C6+(R4C3-R4C4)", 5, 10) _ExcelWriteFormula($oExcel, "=R6C6+(R5C3-R5C4)", 6, 10) $oExcel.ActiveSheet.Columns(10).AutoFit $Graph_position = "B8:K32" $XValueRange = "=Sheet1!R2C1:R6C1" Local $DataRange[5] = [4, "=Sheet1!R2C2:R6C2", "=Sheet1!R2C3:R6C3", "=Sheet1!R2C4:R6C4","=Sheet1!R2C5:R6C5"] Local $DataName[5] = [4, "=Sheet1!B1", "=Sheet1!C1", "=Sheet1!D1", "=Sheet1!E1"] Local $iWorksheet = 1 Local $oChart1 = _XLChart_ChartCreate($oExcel, $iWorksheet, $xlStockOHLC, $Graph_position, "", $XValueRange, $DataRange, $DataName) ; Format chart _XLChart_FillSet($oChart1.Chartgroups(1).UpBars, -4) ; Set the UpBars to green If @error Then MsgBox(64, "Excel Chart Example Script", "Error " & @error & " returned by function '_XLChart_ChartCreate' on line " & @ScriptLineNumber) _XLChart_FillSet($oChart1.Chartgroups(1).DownBars, -3) ; Set the DownBars to red If @error Then MsgBox(64, "Excel Chart Example Script", "Error " & @error & " returned by function '_XLChart_ChartCreate' on line " & @ScriptLineNumber) _XLChart_ColumnGroupSet($oChart1.ChartGroups(1), 450) ; Make the bars smaller (by making the gap between the bars bigger) If @error Then MsgBox(64, "Excel Chart Example Script", "Error " & @error & " returned by function '_XLChart_ChartCreate' on line " & @ScriptLineNumber) If @error Then ConsoleWrite("Line number: " & @ScriptLineNumber & " - Error: " & @error & @CR) ; Add a data series for P _XLChart_SeriesAdd($oChart1, $XValueRange, "=Sheet1!R2C6:R6C6", "=Sheet1!F1") If @error Then ConsoleWrite("Line number: " & @ScriptLineNumber & " - Error: " & @error & @CR) ; Line with markers _XLChart_SeriesSet($oChart1.SeriesCollection(5), $xlLineMarkers) ; Set the size and the type of markers _XLChart_MarkerSet($oChart1.SeriesCollection(5), 30, $xlMarkerStyleDash) If @error Then ConsoleWrite("Line number: " & @ScriptLineNumber & " - Error: " & @error & @CR) ; Set data labels to display the value _XLChart_DatalabelSet($oChart1.SeriesCollection(5)) ; Set the size of the values _XLChart_FontSet($oChart1.SeriesCollection(5).Datalabels, Default, 8) ; Set data line to invisible _XLChart_LineSet($oChart1.SeriesCollection(5), Default, Default, False, Default, Default, $xlSheetHidden) ; Add a data series for S2 _XLChart_SeriesAdd($oChart1, $XValueRange, "=Sheet1!R2C7:R6C7", "=Sheet1!G1") If @error Then ConsoleWrite("Line number: " & @ScriptLineNumber & " - Error: " & @error & @CR) ; Line with markers _XLChart_SeriesSet($oChart1.SeriesCollection(6), $xlLineMarkers) ; Set the size and the type of markers _XLChart_MarkerSet($oChart1.SeriesCollection(6), 30, $xlMarkerStyleDash) If @error Then ConsoleWrite("Line number: " & @ScriptLineNumber & " - Error: " & @error & @CR) ; Set data labels to display the value _XLChart_DatalabelSet($oChart1.SeriesCollection(6)) ; Set the size of the values _XLChart_FontSet($oChart1.SeriesCollection(6).Datalabels, Default, 8) ; Set data line to invisible _XLChart_LineSet($oChart1.SeriesCollection(6), Default, Default, False, Default, Default, $xlSheetHidden) ; Add a data series for S1 _XLChart_SeriesAdd($oChart1, $XValueRange, "=Sheet1!R2C8:R6C8", "=Sheet1!H1") If @error Then ConsoleWrite("Line number: " & @ScriptLineNumber & " - Error: " & @error & @CR) ; Line with markers _XLChart_SeriesSet($oChart1.SeriesCollection(7), $xlLineMarkers) ; Set the size and the type of markers _XLChart_MarkerSet($oChart1.SeriesCollection(7), 30, $xlMarkerStyleDash) If @error Then ConsoleWrite("Line number: " & @ScriptLineNumber & " - Error: " & @error & @CR) ; Set data labels to display the value _XLChart_DatalabelSet($oChart1.SeriesCollection(7)) ; Set the size of the values _XLChart_FontSet($oChart1.SeriesCollection(7).Datalabels, Default, 8) ; Set data line to invisible _XLChart_LineSet($oChart1.SeriesCollection(7), Default, Default, False, Default, Default, $xlSheetHidden) ; Add a data series for R1 _XLChart_SeriesAdd($oChart1, $XValueRange, "=Sheet1!R2C9:R6C9", "=Sheet1!I1") If @error Then ConsoleWrite("Line number: " & @ScriptLineNumber & " - Error: " & @error & @CR) ; Line with markers _XLChart_SeriesSet($oChart1.SeriesCollection(8), $xlLineMarkers) ; Set the size and the type of markers _XLChart_MarkerSet($oChart1.SeriesCollection(8), 30, $xlMarkerStyleDash) If @error Then ConsoleWrite("Line number: " & @ScriptLineNumber & " - Error: " & @error & @CR) ; Set data labels to display the value _XLChart_DatalabelSet($oChart1.SeriesCollection(8)) ; Set the size of the values _XLChart_FontSet($oChart1.SeriesCollection(8).Datalabels, Default, 8) ; Set data line to invisible _XLChart_LineSet($oChart1.SeriesCollection(8), Default, Default, False, Default, Default, $xlSheetHidden) ; Add a data series for R2 _XLChart_SeriesAdd($oChart1, $XValueRange, "=Sheet1!R2C10:R6C10", "=Sheet1!J1") If @error Then ConsoleWrite("Line number: " & @ScriptLineNumber & " - Error: " & @error & @CR) ; Line with markers _XLChart_SeriesSet($oChart1.SeriesCollection(9), $xlLineMarkers) ; Set the size and the type of markers _XLChart_MarkerSet($oChart1.SeriesCollection(9), 30, $xlMarkerStyleDash) If @error Then ConsoleWrite("Line number: " & @ScriptLineNumber & " - Error: " & @error & @CR) ; Set data labels to display the value _XLChart_DatalabelSet($oChart1.SeriesCollection(9)) ; Set the size of the values _XLChart_FontSet($oChart1.SeriesCollection(9).Datalabels, Default, 8) ; Set data line to invisible _XLChart_LineSet($oChart1.SeriesCollection(9), Default, Default, False, Default, Default, $xlSheetHidden) ; Align primary and secondary Y-axis _XLChart_AxisSet($oChart1.Axes($xlValue, 2), $oChart1.Axes($xlValue).MinimumScale, $oChart1.Axes($xlValue).MaximumScale) ; Delete the secondary Y-axis _XLChart_ObjectDelete($oChart1.Axes($xlValue, 2)) ; Enable Screen updating _XLChart_ScreenUpdateSet($oExcel, 1) ; get the values for the Y-axis ;MsgBox(0, "Y-axis minimum value", $oChart1.Axes($xlValue).MinimumScale) ;MsgBox(0, "Y-axis maximum value", $oChart1.Axes($xlValue).MaximumScale) ; Save chart as PNG Local $iFile = @ScriptDir & "TestExcelChartExport.png" _XLChart_ChartExport($oChart1, $iFile, "PNG", False, True) If @error Then ConsoleWrite("Line number: " & @ScriptLineNumber & " - Error: " & @error & @CR) Return EndFunc ;==>Example
-
water, this works really nice! Thank you so much for your help. I have 2 additional questions: How do you set the thickness of the lines added to the chart?Is it possible to call a function/method that will return the min and max value that was set on the Y-axis? In the current exampel it goes from 67 to 70.
-
Thanks water - I will try that. Could you poste the code that you refered to earlier ("... by removing the line and setting the markers size, type and data labels.")? Then I will try to complete my example with your code.
-
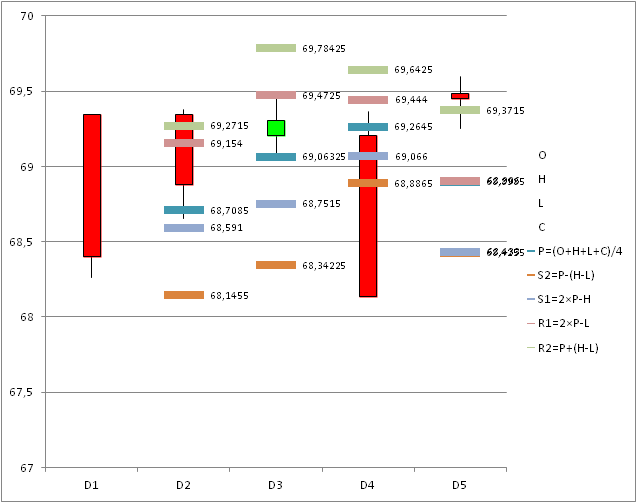
water, this looks really nice and it is very close to the solution I pictured and had hoped for. I'm impressed that it was possible for you to build the solution within the existing Excel Chart UDF framework - but this just shows the power of the UDF you have made. Looking at the screen shot you posted it made me realize why I see R2 below H on some of the bars (which I refered to in my point 2) some 2 posts ago). It seems that the R2 lines refer to the price axis to the right, while OHLC bars refers to the price axis on the left. The 2 price axises are not alligned - e.g. try and look at the value 69. How can they be aligned? Typically the S2 and R2 values will contain the min and max values for a bar, but the L and H can go through these values making them the min and the max values. The aligment needs to take this into acount. I guess what I'm trying to say is, that I would like to avoid that the S2 or R2 is not shown in the chart, because the price axis has been aligned to the L and H (and vice versa). I don't know if this poses any challenges in the alignment - except that I don't know how such an aligment is done.
-
1) A label for e.g. R1 at one end of the line would be enough for me. If the other end could carry the value (like it does in the second chart in the Wiki-link), then that would be great. 4) Thanks for the hint. .. and thank you for helping me out. Best regards, Saxo
-
Thanks water - this managed to move me forward. I have now tried to plot in the R2 values per date. For this I can't use $XlLine, because if I used this and only plot one value, then nothing is shown. So as an alternative I have used $xlLineMarkers - but I would prefer that a line (just as wide as the bar) is shown. Is this possible?The current $xlLineMarkers solution shows some strange output, because D1, D3 & D4 shows R2 below H (?). R2 should be well above H. Is this an error?If point 1) can be solved, then I would like R2 on each date to look the same in terms of color and style (currently Excel picks a new color and marker style per new line that I add). How can this be done?Is it possible to call Excel in hidden mode?The code currently looks like this: #region ;**** Directives created by AutoIt3Wrapper_GUI **** #AutoIt3Wrapper_Res_requestedExecutionLevel=asInvoker #endregion ;**** Directives created by AutoIt3Wrapper_GUI **** #include <ExcelChart.au3> #include <Array.au3> #include <Excel.au3> Example() Exit Func Example() Global $iXLC_Debug = 2 ;(or = 1) Local $oExcel = _ExcelBookNew() _ExcelWriteCell($oExcel, "Date", 1, 1) _ExcelWriteCell($oExcel, "D1", 2, 1) _ExcelWriteCell($oExcel, "D2", 3, 1) _ExcelWriteCell($oExcel, "D3", 4, 1) _ExcelWriteCell($oExcel, "D4", 5, 1) _ExcelWriteCell($oExcel, "D5", 6, 1) $oExcel.ActiveSheet.Columns(1).AutoFit _ExcelWriteCell($oExcel, "O", 1, 2) _ExcelWriteCell($oExcel, "69,342", 2, 2) _ExcelWriteCell($oExcel, "69,342", 3, 2) _ExcelWriteCell($oExcel, "69,203", 4, 2) _ExcelWriteCell($oExcel, "69,204", 5, 2) _ExcelWriteCell($oExcel, "69,485", 6, 2) $oExcel.ActiveSheet.Columns(2).AutoFit _ExcelWriteCell($oExcel, "H", 1, 3) _ExcelWriteCell($oExcel, "68,826", 2, 3) _ExcelWriteCell($oExcel, "69,375", 3, 3) _ExcelWriteCell($oExcel, "69,463", 4, 3) _ExcelWriteCell($oExcel, "69,364", 5, 3) _ExcelWriteCell($oExcel, "69,598", 6, 3) $oExcel.ActiveSheet.Columns(3).AutoFit _ExcelWriteCell($oExcel, "L", 1, 4) _ExcelWriteCell($oExcel, "68,263", 2, 4) _ExcelWriteCell($oExcel, "68,654", 3, 4) _ExcelWriteCell($oExcel, "69,085", 4, 4) _ExcelWriteCell($oExcel, "68,891", 5, 4) _ExcelWriteCell($oExcel, "69,251", 6, 4) $oExcel.ActiveSheet.Columns(4).AutoFit _ExcelWriteCell($oExcel, "C", 1, 5) _ExcelWriteCell($oExcel, "68,403", 2, 5) _ExcelWriteCell($oExcel, "68,882", 3, 5) _ExcelWriteCell($oExcel, "69,307", 4, 5) _ExcelWriteCell($oExcel, "68,135", 5, 5) _ExcelWriteCell($oExcel, "69,450", 6, 5) $oExcel.ActiveSheet.Columns(5).AutoFit _ExcelWriteCell($oExcel, "P=(O+H+L+C)/4", 1, 6) _ExcelWriteFormula($oExcel, "=SUM(R2C2:R2C5)/4", 2, 6) _ExcelWriteFormula($oExcel, "=SUM(R3C2:R3C5)/4", 3, 6) _ExcelWriteFormula($oExcel, "=SUM(R4C2:R4C5)/4", 4, 6) _ExcelWriteFormula($oExcel, "=SUM(R5C2:R5C5)/4", 5, 6) _ExcelWriteFormula($oExcel, "=SUM(R6C2:R6C5)/4", 6, 6) $oExcel.ActiveSheet.Columns(6).AutoFit _ExcelWriteCell($oExcel, "S2=P-(H-L) ", 1, 7) _ExcelWriteFormula($oExcel, "=R2C6-(R2C3-R2C4)", 2, 7) _ExcelWriteFormula($oExcel, "=R3C6-(R3C3-R3C4)", 3, 7) _ExcelWriteFormula($oExcel, "=R4C6-(R4C3-R4C4)", 4, 7) _ExcelWriteFormula($oExcel, "=R5C6-(R5C3-R5C4)", 5, 7) _ExcelWriteFormula($oExcel, "=R6C6-(R6C3-R6C4)", 6, 7) $oExcel.ActiveSheet.Columns(7).AutoFit _ExcelWriteCell($oExcel, "S1=2×P-H", 1, 8) _ExcelWriteFormula($oExcel, "=2*R2C6-R2C3", 2, 8) _ExcelWriteFormula($oExcel, "=2*R3C6-R3C3", 3, 8) _ExcelWriteFormula($oExcel, "=2*R4C6-R4C3", 4, 8) _ExcelWriteFormula($oExcel, "=2*R5C6-R5C3", 5, 8) _ExcelWriteFormula($oExcel, "=2*R6C6-R6C3", 6, 8) $oExcel.ActiveSheet.Columns(8).AutoFit _ExcelWriteCell($oExcel, "R1=2×P-L", 1, 9) _ExcelWriteFormula($oExcel, "=2*R2C6-R2C4", 2, 9) _ExcelWriteFormula($oExcel, "=2*R3C6-R3C4", 3, 9) _ExcelWriteFormula($oExcel, "=2*R4C6-R4C4", 4, 9) _ExcelWriteFormula($oExcel, "=2*R5C6-R5C4", 5, 9) _ExcelWriteFormula($oExcel, "=2*R6C6-R6C4", 6, 9) $oExcel.ActiveSheet.Columns(9).AutoFit _ExcelWriteCell($oExcel, "R2=P+(H-L)", 1, 10) _ExcelWriteFormula($oExcel, "=R2C6+(R2C3-R2C4)", 2, 10) _ExcelWriteFormula($oExcel, "=R3C6+(R3C3-R3C4)", 3, 10) _ExcelWriteFormula($oExcel, "=R4C6+(R4C3-R4C4)", 4, 10) _ExcelWriteFormula($oExcel, "=R5C6+(R5C3-R5C4)", 5, 10) _ExcelWriteFormula($oExcel, "=R6C6+(R6C3-R6C4)", 6, 10) $oExcel.ActiveSheet.Columns(10).AutoFit _ExcelWriteCell($oExcel, "R2 on D1", 1, 11) _ExcelWriteFormula($oExcel, "=R2C6+(R2C3-R2C4)", 2, 11) _ExcelWriteFormula($oExcel, "", 3, 11) _ExcelWriteFormula($oExcel, "", 4, 11) _ExcelWriteFormula($oExcel, "", 5, 11) _ExcelWriteFormula($oExcel, "", 6, 11) $oExcel.ActiveSheet.Columns(11).AutoFit _ExcelWriteCell($oExcel, "R2 on D2", 1, 12) _ExcelWriteFormula($oExcel, "", 2, 12) _ExcelWriteFormula($oExcel, "=R3C6+(R3C3-R3C4)", 3, 12) _ExcelWriteFormula($oExcel, "", 4, 12) _ExcelWriteFormula($oExcel, "", 5, 12) _ExcelWriteFormula($oExcel, "", 6, 12) $oExcel.ActiveSheet.Columns(12).AutoFit _ExcelWriteCell($oExcel, "R2 on D3", 1, 13) _ExcelWriteFormula($oExcel, "", 2, 13) _ExcelWriteFormula($oExcel, "", 3, 13) _ExcelWriteFormula($oExcel, "=R4C6+(R4C3-R4C4)", 4, 13) _ExcelWriteFormula($oExcel, "", 5, 13) _ExcelWriteFormula($oExcel, "", 6, 13) $oExcel.ActiveSheet.Columns(13).AutoFit _ExcelWriteCell($oExcel, "R2 on D4", 1, 14) _ExcelWriteFormula($oExcel, "", 2, 14) _ExcelWriteFormula($oExcel, "", 3, 14) _ExcelWriteFormula($oExcel, "", 4, 14) _ExcelWriteFormula($oExcel, "=R5C6+(R5C3-R5C4)", 5, 14) _ExcelWriteFormula($oExcel, "", 6, 14) $oExcel.ActiveSheet.Columns(14).AutoFit _ExcelWriteCell($oExcel, "R2 on D5", 1, 15) _ExcelWriteFormula($oExcel, "", 2, 15) _ExcelWriteFormula($oExcel, "", 3, 15) _ExcelWriteFormula($oExcel, "", 4, 15) _ExcelWriteFormula($oExcel, "", 5, 15) _ExcelWriteFormula($oExcel, "=R6C6+(R6C3-R6C4)", 6, 15) $oExcel.ActiveSheet.Columns(15).AutoFit $Graph_position = "B8:K32" $XValueRange = "=Sheet1!R2C1:R6C1" Local $DataRange[5] = [4, "=Sheet1!R2C2:R6C2", "=Sheet1!R2C3:R6C3", "=Sheet1!R2C4:R6C4","=Sheet1!R2C5:R6C5"] Local $DataName[5] = [4, "=Sheet1!B1", "=Sheet1!C1", "=Sheet1!D1", "=Sheet1!E1"] Local $iWorksheet = 1 Local $oChart1 = _XLChart_ChartCreate($oExcel, $iWorksheet, $xlStockOHLC, $Graph_position, "", $XValueRange, $DataRange, $DataName) ; Add a data series _XLChart_SeriesAdd($oChart1, $XValueRange, "=Sheet1!R2C11:R6C11", "=Sheet1!K1") If @error Then ConsoleWrite("Line number: " & @ScriptLineNumber & " - Error: " & @error & @CR) _XLChart_SeriesSet($oChart1.SeriesCollection(5), $xlLineMarkers) If @error Then ConsoleWrite("Line number: " & @ScriptLineNumber & " - Error: " & @error & @CR) _XLChart_SeriesAdd($oChart1, $XValueRange, "=Sheet1!R2C12:R6C12", "=Sheet1!L1") If @error Then ConsoleWrite("Line number: " & @ScriptLineNumber & " - Error: " & @error & @CR) _XLChart_SeriesSet($oChart1.SeriesCollection(6), $xlLineMarkers) If @error Then ConsoleWrite("Line number: " & @ScriptLineNumber & " - Error: " & @error & @CR) _XLChart_SeriesAdd($oChart1, $XValueRange, "=Sheet1!R2C13:R6C13", "=Sheet1!M1") If @error Then ConsoleWrite("Line number: " & @ScriptLineNumber & " - Error: " & @error & @CR) _XLChart_SeriesSet($oChart1.SeriesCollection(7), $xlLineMarkers) If @error Then ConsoleWrite("Line number: " & @ScriptLineNumber & " - Error: " & @error & @CR) _XLChart_SeriesAdd($oChart1, $XValueRange, "=Sheet1!R2C14:R6C14", "=Sheet1!N1") If @error Then ConsoleWrite("Line number: " & @ScriptLineNumber & " - Error: " & @error & @CR) _XLChart_SeriesSet($oChart1.SeriesCollection(8), $xlLineMarkers) If @error Then ConsoleWrite("Line number: " & @ScriptLineNumber & " - Error: " & @error & @CR) _XLChart_SeriesAdd($oChart1, $XValueRange, "=Sheet1!R2C15:R6C15", "=Sheet1!O1") If @error Then ConsoleWrite("Line number: " & @ScriptLineNumber & " - Error: " & @error & @CR) _XLChart_SeriesSet($oChart1.SeriesCollection(9), $xlLineMarkers) If @error Then ConsoleWrite("Line number: " & @ScriptLineNumber & " - Error: " & @error & @CR) ; Set the type of the data series ;_XLChart_SeriesSet($oChart1.SeriesCollection(5), $XlLine) ;_XLChart_SeriesSet($oChart1.SeriesCollection(5), $xlLineMarkers) ; HOW TO make a '_' instead of a '*' marking? ;_XLChart_FillSet($oChart1.SeriesCollection(5).Line, -4) ; HOW TO color the line and pick it's style? ;_XLChart_FillSet($oExcel[1].SeriesCollection(5).Line, -4) ;$oExcel[1].SeriesCollection(11).Points(5) ; Format chart _XLChart_FillSet($oChart1.Chartgroups(1).UpBars, -4) ; Set the UpBars to green If @error Then MsgBox(64, "Excel Chart Example Script", "Error " & @error & " returned by function '_XLChart_ChartCreate' on line " & @ScriptLineNumber) _XLChart_FillSet($oChart1.Chartgroups(1).DownBars, -3) ; Set the DownBars to red If @error Then MsgBox(64, "Excel Chart Example Script", "Error " & @error & " returned by function '_XLChart_ChartCreate' on line " & @ScriptLineNumber) _XLChart_ColumnGroupSet($oChart1.ChartGroups(1), 450) ; Make the bars smaller (by making the gap between the bars bigger) If @error Then MsgBox(64, "Excel Chart Example Script", "Error " & @error & " returned by function '_XLChart_ChartCreate' on line " & @ScriptLineNumber) If @error Then ConsoleWrite("Line number: " & @ScriptLineNumber & " - Error: " & @error & @CR) Local $iFile = @ScriptDir & "TestExcelChartExport.png" _XLChart_ChartExport($oChart1, $iFile, "PNG", False, True) If @error Then ConsoleWrite("Line number: " & @ScriptLineNumber & " - Error: " & @error & @CR) Return EndFunc ;==>Example
-
Hi, I have not been able to figure out how to add a new series to the chart created. After the _XLChart_ChartCreate I have tried with: ;_XLChart_SeriesSet($oExcel.SeriesCollection(6), $xlLine) ;_XLChart_SeriesSet($oExcel[1].SeriesCollection(6), $xlLine) ;$oNewChartSerie = $oChart1.SeriesCollection.NewSeries ;$oNewChartSerie = $oExcel.SeriesCollection(6) ;_XLChart_SeriesSet($oNewChartSerie, $xlLine) My aim is to plot a line per calculate point (S2, S1, P, R1, R2) per date, so that it on a date e.g. the second would look something like: _ _ _ _ _ 2 I believe that I with 5 points per day for 5 days would need 25 series where each serie would only contain a value for the date it needs to be calculated for (the rest of the dates would have blank value). I don't know if this is the right way or if there is a smarter way. But I'm stuck as long as I don't know how to add a line to the existing chart. _
-
Thx water - works great! I have continued with the example. My goal is to calculate Pivot Points (see http://en.wikipedia.org/wiki/Pivot_point) and plot them in the Excel chart per date bar. Is it possible to make such plots and if so, how is it done (preferably with with different coloring and labeling of the 5 points per bar)? Calculating the Pivot Points inside Excel has faced me with the following issues: I would like to format the prices so that they are written e.g. 69,450 instead of 69.450 (I assume that .NumberFormat should be used somehow). Currently the calculations are messed up because of this.Is there a smarter way for me to write the same formula accros many rows (other than repeating it in the code like I did)?Below I have pasted the code like it looks now.Best regards, Saxo #region ;**** Directives created by AutoIt3Wrapper_GUI **** #AutoIt3Wrapper_Res_requestedExecutionLevel=asInvoker #endregion ;**** Directives created by AutoIt3Wrapper_GUI **** #include <ExcelChart.au3> #include <Array.au3> #include <Excel.au3> Example() Exit Func Example() Local $oExcel = _ExcelBookNew() _ExcelWriteCell($oExcel, "Date", 1, 1) _ExcelWriteCell($oExcel, "02/24/2012", 2, 1) _ExcelWriteCell($oExcel, "02/23/2012", 3, 1) _ExcelWriteCell($oExcel, "02/22/2012", 4, 1) _ExcelWriteCell($oExcel, "02/21/2012", 5, 1) _ExcelWriteCell($oExcel, "02/17/2012", 6, 1) $oExcel.ActiveSheet.Columns(1).AutoFit _ExcelWriteCell($oExcel, "O", 1, 2) _ExcelWriteCell($oExcel, "68.682", 2, 2) _ExcelWriteCell($oExcel, "69.342", 3, 2) _ExcelWriteCell($oExcel, "69.203", 4, 2) _ExcelWriteCell($oExcel, "69.204", 5, 2) _ExcelWriteCell($oExcel, "69.485", 6, 2) $oExcel.ActiveSheet.Columns(2).AutoFit _ExcelWriteCell($oExcel, "H", 1, 3) _ExcelWriteCell($oExcel, "68.826", 2, 3) _ExcelWriteCell($oExcel, "69.375", 3, 3) _ExcelWriteCell($oExcel, "69.463", 4, 3) _ExcelWriteCell($oExcel, "69.364", 5, 3) _ExcelWriteCell($oExcel, "69.598", 6, 3) $oExcel.ActiveSheet.Columns(3).AutoFit _ExcelWriteCell($oExcel, "L", 1, 4) _ExcelWriteCell($oExcel, "68.263", 2, 4) _ExcelWriteCell($oExcel, "68.654", 3, 4) _ExcelWriteCell($oExcel, "69.085", 4, 4) _ExcelWriteCell($oExcel, "68.891", 5, 4) _ExcelWriteCell($oExcel, "69.251", 6, 4) $oExcel.ActiveSheet.Columns(4).AutoFit _ExcelWriteCell($oExcel, "C", 1, 5) _ExcelWriteCell($oExcel, "68.403", 2, 5) _ExcelWriteCell($oExcel, "68.882", 3, 5) _ExcelWriteCell($oExcel, "69.307", 4, 5) _ExcelWriteCell($oExcel, "68.135", 5, 5) _ExcelWriteCell($oExcel, "69.450", 6, 5) $oExcel.ActiveSheet.Columns(5).AutoFit ;$oExcel.ActiveSheet.Range("B2").NumberFormat = "#,###" ; How to change e.g. "69.450" to "69,450" ... for all price cells? _ExcelWriteCell($oExcel, "P=(O+H+L+C)/4", 1, 6) _ExcelWriteFormula($oExcel, "=SUM(R2C2:R2C5)/4", 2, 6) _ExcelWriteFormula($oExcel, "=SUM(R3C2:R3C5)/4", 3, 6) _ExcelWriteFormula($oExcel, "=SUM(R4C2:R4C5)/4", 4, 6) _ExcelWriteFormula($oExcel, "=SUM(R5C2:R5C5)/4", 5, 6) _ExcelWriteFormula($oExcel, "=SUM(R6C2:R6C5)/4", 6, 6) $oExcel.ActiveSheet.Columns(6).AutoFit _ExcelWriteCell($oExcel, "S2=P-(H-L) ", 1, 7) _ExcelWriteFormula($oExcel, "=R2C6-(R2C3-R2C4)", 2, 7) _ExcelWriteFormula($oExcel, "=R3C6-(R3C3-R3C4)", 3, 7) _ExcelWriteFormula($oExcel, "=R4C6-(R4C3-R4C4)", 4, 7) _ExcelWriteFormula($oExcel, "=R5C6-(R5C3-R5C4)", 5, 7) _ExcelWriteFormula($oExcel, "=R6C6-(R6C3-R6C4)", 6, 7) $oExcel.ActiveSheet.Columns(7).AutoFit _ExcelWriteCell($oExcel, "S1=2×P-H", 1, 8) _ExcelWriteFormula($oExcel, "=2*R2C6-R2C3", 2, 8) _ExcelWriteFormula($oExcel, "=2*R3C6-R3C3", 3, 8) _ExcelWriteFormula($oExcel, "=2*R4C6-R4C3", 4, 8) _ExcelWriteFormula($oExcel, "=2*R5C6-R5C3", 5, 8) _ExcelWriteFormula($oExcel, "=2*R6C6-R6C3", 6, 8) $oExcel.ActiveSheet.Columns(8).AutoFit _ExcelWriteCell($oExcel, "R1=2×P-L", 1, 9) _ExcelWriteFormula($oExcel, "=2*R2C6-R2C4", 2, 9) _ExcelWriteFormula($oExcel, "=2*R3C6-R3C4", 3, 9) _ExcelWriteFormula($oExcel, "=2*R4C6-R4C4", 4, 9) _ExcelWriteFormula($oExcel, "=2*R5C6-R5C4", 5, 9) _ExcelWriteFormula($oExcel, "=2*R6C6-R6C4", 6, 9) $oExcel.ActiveSheet.Columns(9).AutoFit _ExcelWriteCell($oExcel, "R2=P+(H-L)", 1, 10) _ExcelWriteFormula($oExcel, "=R2C6+(R2C3-R2C4)", 2, 10) _ExcelWriteFormula($oExcel, "=R3C6+(R3C3-R3C4)", 3, 10) _ExcelWriteFormula($oExcel, "=R4C6+(R4C3-R4C4)", 4, 10) _ExcelWriteFormula($oExcel, "=R5C6+(R5C3-R5C4)", 5, 10) _ExcelWriteFormula($oExcel, "=R6C6+(R6C3-R6C4)", 6, 10) $oExcel.ActiveSheet.Columns(10).AutoFit $Graph_position = "K2:T24" $XValueRange = "=Sheet1!R2C1:R6C1" Local $DataRange[5] = [4, "=Sheet1!R2C2:R6C2", "=Sheet1!R2C3:R6C3", "=Sheet1!R2C4:R6C4","=Sheet1!R2C5:R6C5"] Local $DataName[5] = [4, "=Sheet1!B1", "=Sheet1!C1", "=Sheet1!D1", "=Sheet1!E1"] Local $iWorksheet = 1 Local $oChart1 = _XLChart_ChartCreate($oExcel, $iWorksheet, $xlStockOHLC, $Graph_position, "", $XValueRange, $DataRange, $DataName) If @error Then ConsoleWrite("Line number: " & @ScriptLineNumber & " - Error: " & @error & @CR) Local $iFile = @ScriptDir & "TestExcelChartExport.png" _XLChart_ChartExport($oChart1, $iFile, "PNG", False, True) If @error Then ConsoleWrite("Line number: " & @ScriptLineNumber & " - Error: " & @error & @CR) Return EndFunc ;==>Example
-
Water, thank you for your very fast reply. I'm not sure how to post the image, but it is a normal 2D column chart with dates on the x-axis and price on the y-axis. 2 different columns are shown per date. Hope this helps you in your investigation.
-
Hi, this looks like really cool UDF stuff, but I'm having problems getting $xlStockOHLC (some other chart type is created) and _XLChart_ChartExport to work (.png file is created but does not contain the chart exported from Excel). What am I doing wrong? Best regards, Saxo #Region ;**** Directives created by AutoIt3Wrapper_GUI **** #AutoIt3Wrapper_Res_requestedExecutionLevel=asInvoker #EndRegion ;**** Directives created by AutoIt3Wrapper_GUI **** #include <ExcelChart.au3> #include <Array.au3> #include <Excel.au3> Example() Exit Func Example() Global $oExcel = _ExcelBookNew() _ExcelWriteCell($oExcel, "Date", 1, 1) _ExcelWriteCell($oExcel, "02/24/2012", 2, 1) _ExcelWriteCell($oExcel, "02/23/2012", 3, 1) _ExcelWriteCell($oExcel, "02/22/2012", 4, 1) _ExcelWriteCell($oExcel, "02/21/2012", 5, 1) _ExcelWriteCell($oExcel, "02/17/2012", 6, 1) $oExcel.ActiveSheet.Columns(1).AutoFit _ExcelWriteCell($oExcel, "Open", 1, 2) _ExcelWriteCell($oExcel, "68.682", 2, 2) _ExcelWriteCell($oExcel, "69.342", 3, 2) _ExcelWriteCell($oExcel, "69.203", 4, 2) _ExcelWriteCell($oExcel, "69.204", 5, 2) _ExcelWriteCell($oExcel, "69.485", 6, 2) $oExcel.ActiveSheet.Columns(2).AutoFit _ExcelWriteCell($oExcel, "High", 1, 3) _ExcelWriteCell($oExcel, "68.826", 2, 3) _ExcelWriteCell($oExcel, "69.375", 3, 3) _ExcelWriteCell($oExcel, "69.463", 4, 3) _ExcelWriteCell($oExcel, "69.364", 5, 3) _ExcelWriteCell($oExcel, "69.598", 6, 3) $oExcel.ActiveSheet.Columns(3).AutoFit _ExcelWriteCell($oExcel, "Low", 1, 4) _ExcelWriteCell($oExcel, "68.263", 2, 4) _ExcelWriteCell($oExcel, "68.654", 3, 4) _ExcelWriteCell($oExcel, "69.085", 4, 4) _ExcelWriteCell($oExcel, "68.891", 5, 4) _ExcelWriteCell($oExcel, "69.251", 6, 4) $oExcel.ActiveSheet.Columns(4).AutoFit _ExcelWriteCell($oExcel, "Close", 1, 5) _ExcelWriteCell($oExcel, "68.403", 2, 5) _ExcelWriteCell($oExcel, "68.882", 3, 5) _ExcelWriteCell($oExcel, "69.307", 4, 5) _ExcelWriteCell($oExcel, "68.135", 5, 5) _ExcelWriteCell($oExcel, "69.450", 6, 5) $oExcel.ActiveSheet.Columns(5).AutoFit $Graph_position = "K2:T24" $XValueRange = "=Sheet1!R2C1:R6C1" Dim $DataRange[3]=[2,"=Sheet1!R2C2:R6C2","=Sheet1!R2C5:R6C5"] Dim $DataName [3]=[2,"=Sheet1!R1C2:R1C2","=Sheet1!R1C5:R1C5"] Local $iWorksheet = 1 Local $oChart1 = _XLChart_ChartCreate($oExcel, $iWorksheet, $xlStockOHLC, $Graph_position, "", $XValueRange, $DataRange, $DataName);, True, "Sales", "Date", "", "Quantity") If @error Then ConsoleWrite("Line number: " & @ScriptLineNumber & " - Error: " & @error & @CR) Local $iFile = @ScriptDir &"TestExcelChartExport.png" _XLChart_ChartExport($oChart1, $iFile, "") Return EndFunc ;==> Example