Search the Community
Showing results for tags 'semilog plot _graphgdiplus'.
Found 1 result
-
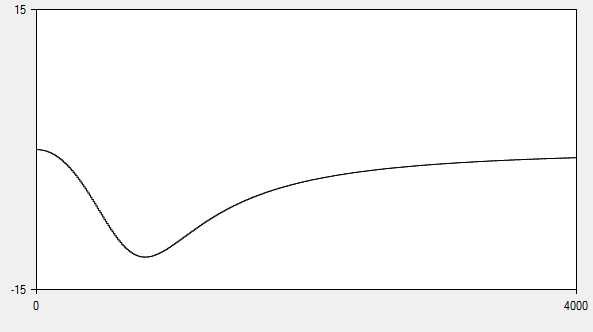
Hi, I'm working with Graph GDIPlus library (very useful and appreciated) An example of my result is here: By default x-axis and y-axis are both linear. I need a semilog plot with x-axis logarithmic (1-10-100-1000... at equal distances ) and y-axis linear. Any help, hint or suggestion is very appreciated. Thanks on advance. Regards. Giorgio.